ICT Liquidity Sweep/Swing Fail Pattern V.1# ICT Liquidity Sweep/Swing Fail Pattern V.1
## Indicator Description & User Guide
---
## 📊 Indicator Overview
**Name:** ICT Liquidity Sweep/Swing Fail Pattern V.1
**Type:** Support/Resistance & Liquidity Detection
**Trading Style:** ICT Concepts (Inner Circle Trader)
**Best Timeframes:** 1M, 5M, 15M, 1H
---
## 🎯 Core Features
### 1. **Support & Resistance Lines**
- Automatically draws key swing high and swing low levels
- Based on significant pivot points in price structure
- Updates dynamically as new swings form
### 2. **"X" Mark - Liquidity Sweep**
- **Symbol:** X marker on chart
- **Meaning:** Indicates a liquidity sweep (stop hunt)
- **What it shows:** Price briefly moved beyond a key level to trigger stops, then reversed
- **Trading significance:** High-probability reversal zones after liquidity is taken
### 3. **"SFP" Label - Swing Failure Pattern**
- **Symbol:** SFP text label
- **Meaning:** Swing Failure Pattern detected
- **What it shows:** Price attempted to make a new high/low but failed and reversed sharply
- **Trading significance:** Strong reversal signal - smart money rejecting the level
---
## 📈 How to Use This Indicator
### Entry Setup Strategy:
#### **For SHORT Trades (Sell):**
1. Wait for **SFP** to appear at a swing high
2. Look for **X marker** confirming liquidity sweep above the high
3. **Entry Zone (Red Box):** Enter SHORT positions when price returns to this zone
4. **Stop Loss:** Place above the red zone (above the swept high)
5. **Take Profit (Green Box):** Target the green zone below
#### **For LONG Trades (Buy):**
1. Wait for **SFP** to appear at a swing low
2. Look for **X marker** confirming liquidity sweep below the low
3. **Entry Zone (Green Box):** Enter LONG positions when price returns to this zone
4. **Stop Loss:** Place below the green zone (below the swept low)
5. **Take Profit (Red Box):** Target the red zone above
---
## 🎨 Color Coding System
| Color | Zone Type | Usage |
|-------|-----------|-------|
| 🔴 **Red Box** | Stop Loss / Supply Zone | Place SL here for LONG trades / Entry zone for SHORT trades |
| 🟢 **Green Box** | Take Profit / Demand Zone | Target zone for LONG trades / Place SL here for SHORT trades |
| ❌ **X Mark** | Liquidity Sweep Point | Stop hunt occurred - reversal likely |
| 📝 **SFP Label** | Swing Failure Pattern | Failed breakout - strong reversal signal |
---
## 💡 Trading Examples
### Example 1: SHORT Trade (As shown in your chart)
```
1. SFP appears at swing high (Red zone around 4,000)
2. X marker confirms liquidity sweep above the high
3. Entry: SHORT when price re-enters red zone
4. Stop Loss: Above red zone (e.g., 4,002)
5. Take Profit: Green zone below (3,964-3,972)
6. Risk:Reward = 1:3+
```
### Example 2: LONG Trade
```
1. SFP appears at swing low (Green zone)
2. X marker confirms liquidity sweep below the low
3. Entry: LONG when price re-enters green zone
4. Stop Loss: Below green zone
5. Take Profit: Previous red zone above
6. Risk:Reward = 1:2 minimum
```
---
## ⚠️ Important Trading Rules
### ✅ DO:
- Wait for BOTH SFP and X marker confirmation
- Enter on price returning to the zone (not on first touch)
- Use proper position sizing (1-2% risk per trade)
- Combine with market structure analysis
- Look for confluences (orderblocks, fair value gaps)
### ❌ DON'T:
- Trade against the higher timeframe trend
- Enter without confirmation signals
- Ignore the colored zones for SL/TP placement
- Overtrade - wait for quality setups
- Move stop loss to breakeven too early
---
## 🔧 Indicator Settings (Typical)
**Adjustable Parameters:**
- Swing Length: Number of bars to identify swing points
- Show/Hide X markers
- Show/Hide SFP labels
- Zone opacity and colors
- Line thickness
---
## 📚 ICT Concepts Explained
### **Liquidity Sweep:**
Smart money intentionally pushes price beyond key levels to trigger retail stop losses, then reverses to their intended direction. The X marker identifies these moments.
### **Swing Failure Pattern (SFP):**
Price attempts to make a new high/low but lacks follow-through, indicating weak momentum and likely reversal. Similar to a "false breakout" but more specific to swing structures.
### **Supply & Demand Zones:**
- **Red zones** = Areas where selling pressure overwhelmed buyers
- **Green zones** = Areas where buying pressure overwhelmed sellers
- These zones act as magnets for price to return and react
---
## 🎓 Best Practices
1. **Confluence is Key:**
- Combine with daily/weekly bias
- Check for orderblocks nearby
- Look for imbalances (FVG)
2. **Session Timing:**
- Best during London/New York sessions
- Avoid low liquidity periods
3. **Risk Management:**
- Never risk more than 1-2% per trade
- Use proper lot sizing
- Take partial profits at key levels
4. **Timeframe Correlation:**
- Check higher timeframe for bias
- Enter on lower timeframe for precision
- Exit based on higher timeframe targets
---
## 📞 Support & Updates
**Version:** 1.0
**Compatibility:** TradingView Pine Script v5
**Updates:** Regular improvements based on ICT methodology
---
## ⚡ Quick Reference Card
| Signal | Action | SL Placement | TP Target |
|--------|--------|--------------|-----------|
| SFP + X at High | SHORT at Red Zone | Above Red | Green Zone |
| SFP + X at Low | LONG at Green Zone | Below Green | Red Zone |
**Remember:** The indicator shows you WHERE to trade, but YOU decide WHEN based on confirmation and market context.
---
*Disclaimer: This indicator is a tool for technical analysis. Always use proper risk management and never trade with money you cannot afford to lose.*
Wyszukaj w skryptach "pivot points"

Clean Projected Camarilla (No History)Here is a professional description you can use for the indicator settings or if you publish this script on TradingView.Indicator Name: Clean Projected Camarilla Levels (Dynamic)Description:This indicator calculates and projects future Camarilla Pivot points based on the current, developing market data. Unlike standard pivot indicators that show past levels, this tool is designed for forward-looking analysis, showing you where the next period's Support and Resistance levels will be if the market closed at the current price.Key Features:Zero Clutter: Utilizes line.new drawing functions to ensure only the current projected levels are visible. No historical trails or "ghost lines" are left on the chart.Dynamic Updates: The levels (R4, R3, S3, S4) update in real-time with every tick as the current High, Low, and Close change.Multi-Timeframe Capable: By default, it projects the Next Quarter's levels (using 3M data), but can be customized to project Next Day, Next Week, or Next Month levels via the settings menu.Visual Aid: Lines automatically extend to the right for easy visibility against current price action.Formulas Used:R4 / S4 (Breakout Levels): Calculated using the $1.1/2$ range multiplier. A break beyond these often signals a trend continuation.R3 / S3 (Reversal Levels): Calculated using the $1.1/4$ range multiplier. These are the primary zones for mean reversion or "fade" trades.How to Use:Use this tool to anticipate future boundaries before the current period closes.Scenario A: If the Projected R4 moves significantly away from the current price, volatility is expanding.Scenario B: If price is approaching the Projected R3, be aware that this level might act as resistance in the upcoming session.

Unchased Wick Detector and ReversalsThis indicator can be used to track unchased wick from previous pivot points.
The idea is to visualise liquidity cluster and grab before a potential reversal.
Unchased wick Visual:
- White lines are protected highs or lows.
- Gray lines are previous wicks where prices have passed through and where the prices did not reverse.
Reversal window:
Reversal window parameters define a period range (a min and a max bars) where the reversal is valid.
The idea is that the reversal must be done in the couple bars right after the wick is chased (this event should stay short in time but you can adjust the period as you wish).
By default the default, the window 1-5 bars (e.g., daily, during 1-5 days).
Green color indicates a grab from a low and a reversal to the upside.
Red color indicates a grab from a high and a reversal to the downside.
Disclamer:
Of course this indicator can lead to false reversal signals and must be combined with other data and must be careful to use it alone for opening any position.
This indicator is a Alpha version let me know if any problem.

Structure Analysis + Hammer Alert# Structure Resistance + Hammer Alert
## 📊 Indicator Overview
This indicator integrates Structure Breakout Analysis with Candlestick Pattern Recognition, helping traders identify market trend reversal points and strong momentum signals. Through visual markers and background colors, you can quickly grasp the bullish/bearish market structure.
---
## 🎯 Core Features
### 1️⃣ Structure Resistance System
- Auto-plot Previous High/Low: Automatically marks key support/resistance based on pivot points
- Structure Breakout Detection: Shows "BULL" when price breaks above previous high, "BEAR" when breaking below previous low
- Trend Background Color: Green background for bullish structure, red background for bearish structure
### 2️⃣ Bullish Momentum Candles (Hammer Patterns)
Detects candles with long lower shadows, indicating strong buying pressure at lows:
- 💪Strong Bull (Bullish Hammer): Green marker, bullish close with significant lower shadow
- 💪Weak Bull (Bearish Hammer): Teal marker, bearish close but strong lower shadow
### 3️⃣ Bearish Momentum Candles (Inverted Hammer/Shooting Star)
Detects candles with long upper shadows, indicating strong selling pressure at highs:
- 💪Weak Bear (Bullish Inverted Hammer): Orange marker, bullish close but significant upper shadow
- 💪Strong Bear (Shooting Star): Red marker, bearish close with significant upper shadow
### 4️⃣ Smart Marker Sizing
Markers automatically adjust size based on current trend:
- With-Trend Signals: Larger markers (e.g., hammer in bullish trend)
- Counter-Trend Signals: Smaller markers (e.g., shooting star in bullish trend)
- Neutral Trend: Medium-sized markers
---
## ⚙️ Parameter Settings
### Structure Resistance Parameters
- Swing Length: Default 5, higher values = clearer structure but fewer signals
- Show Lines/Labels: Toggle on/off options
### Bullish Momentum (Hammer) Parameters
- Lower Shadow/Body Ratio: Default 2.0, lower shadow must be 2x body size
- Upper Shadow/Body Ratio Limit: Default 0.2, upper shadow cannot be too long
- Body Position Ratio: Default 2.0, ensures body is at the top of candle
### Bearish Momentum (Inverted Hammer) Parameters
- Upper Shadow/Body Ratio: Default 2.0, upper shadow must be 2x body size
- Lower Shadow/Body Ratio Limit: Default 0.2, lower shadow cannot be too long
- Body Position Ratio: Default 2.0, ensures body is at the bottom of candle
### Filter & Display Settings
- Minimum Body Size: Filters out doji-like candles with tiny bodies
- Pattern Type Toggles: Show/hide different pattern types individually
- Background Transparency: Adjust background color intensity (higher = more transparent)
- Label Distance: Adjust marker distance from candles
---
## 📈 Usage Guidelines
### Trading Signal Interpretation
**Long Signals (Strongest to Weakest):**
1. Bullish Structure + Bullish Hammer (💪Strong Bull) → Strongest long signal
2. Bullish Structure + Bearish Hammer (💪Weak Bull) → Secondary long signal
3. Bearish Structure + Hammer → Potential reversal signal
**Short Signals (Strongest to Weakest):**
1. Bearish Structure + Shooting Star (💪Strong Bear) → Strongest short signal
2. Bearish Structure + Bullish Inverted Hammer (💪Weak Bear) → Secondary short signal
3. Bullish Structure + Shooting Star → Potential reversal signal
### Practical Tips
✅ Trend Following: Prioritize large marker signals (aligned with trend)
✅ Structure Confirmation: Wait for structure breakout before entry to avoid false breaks
✅ Multiple Timeframes: Confirm trend direction with higher timeframes
⚠️ Counter-Trend Caution: Small marker signals (counter-trend) require stricter risk management
---
## 🔔 Alert Setup
This indicator provides 9 alert conditions:
- Individual Patterns: Bullish Hammer, Bearish Hammer, Bullish Inverted Hammer, Shooting Star
- Combined Signals: Bullish Momentum, Bearish Momentum, Bull/Bear Momentum
- Structure Breakouts: Bullish Structure Break, Bearish Structure Break
---
## 💡 FAQ
**Q: Why do hammers sometimes appear without markers?**
A: Check "Minimum Body Size" setting - the candle body may be too small and filtered out
**Q: Too many or too few markers?**
A: Adjust "Lower Shadow/Body Ratio" or "Upper Shadow/Body Ratio" parameters - higher ratios = stricter conditions
**Q: How to see only the strongest signals?**
A: Disable "Bearish Hammer" and "Bullish Inverted Hammer", keep only "Bullish Hammer" and "Shooting Star"
**Q: Can it be used on all timeframes?**
A: Yes, but recommended for 15-minute and higher timeframes - shorter timeframes have more noise
---
## 📝 Disclaimer
⚠️ This indicator is a supplementary tool and should be used with other technical analysis methods
⚠️ Past performance does not guarantee future results - always practice proper risk management
⚠️ Recommended to test on demo account before live trading
---
**Version:** Pine Script v6
**Applicable Markets:** Stocks, Futures, Cryptocurrencies, and all markets

Vdubus Divergence Wave Pattern Generator V1The Vdubus Divergence Wave Theory
10 years in the making & now finally thanks to AI I have attempted to put my Trading strategy & logic into a visual representation of how I analyse and project market using Core price action & MacD. Enjoy :)
A Proprietary Structural & Momentum Confluence SystemPart 1: The Strategic Concept1. The Core Philosophy: "Geometry + Physics"Traditional technical analysis often fails because traders confuse location with timing.Geometry (Price Patterns): Tells us WHERE the market is likely to reverse (e.g., at a resistance level or harmonic D-point).Physics (Momentum): Tells us WHEN the energy driving the trend has actually shifted. The Vdubus Theory posits that a trade should never be taken based on Geometry alone. A valid signal requires a specific, fractal decay in momentum—a "Handshake" between price structure and energy exhaustion.2. The 3-Wave Momentum Filter (The Engine)Most traders look for simple divergence (2 points). The Vdubus Theory demands a 3-Wave Structure to confirm the true state of the market.A. The Standard Reversal (Exhaustion)This is the "Safe" entry, catching the slow death of a trend.Wave 1 $\rightarrow$ 2 (The Warning): Price pushes higher, but momentum is lower (Standard Divergence). This signals that the trend is tapping the brakes.Wave 2 $\rightarrow$ 3 (The Confirmation): Price pushes to a final extreme (often a stop-hunt), but momentum is flat or lower than Wave 2 ("No Divergence").The Logic: This confirms that the buyers have expended all remaining energy. The engine is dead.
B. The Climax Reversal (The Trap)This is the "Aggressive" entry, catching V-shape reversals.Wave 1 $\rightarrow$ 2 (The Bait): Price pushes higher, and momentum is Stronger/Higher (No Divergence). This sucks in retail traders who believe the trend is accelerating.Wave 2 $\rightarrow$ 3 (The Snap): Price pushes again, but momentum suddenly collapses (Divergence).The Logic: A "Strong to Weak" shift. The market traps traders with a show of strength before hitting a "concrete wall" of limit orders.C. The Predator (The Trend Continuation)The Logic: Trends rarely move in straight lines. The "Predator" looks for Hidden Divergence during a pullback.The Signal: Price makes a Higher Low (Trend Structure Intact), but Momentum makes a Lower Low (Oversold Trap). This signals the end of the correction and the resumption of the main trend.3. The "Clean Path" PrincipleA trade is only valid if there is no opposing force. If you are looking to Sell (Bearish Reversal), the opposing Bullish momentum must be weak or neutral. If the "Enemy" is strong, the trade is skipped.
Part 2: The Indicator Breakdown
Tool Name: Vdubus Divergence Wave Pattern Generator V1
This script automates your analysis by combining ZigZag Pattern Recognition (Geometry) with your Custom MACD Logic (Physics).
1. The "Golden" Settings
The physics engine is tuned to your specific discovery:
Fast Length: 8
Slow Length: 21
Signal Length: 5
Lookback: 3 (Sensitive enough to catch the exact pivot points).
2. Signal Generation Logic
The indicator scans for four distinct setups. Here is the exact logic code translated into English:
Signal 1: Standard Reversal (Green/Red Pattern)
Geometry: The ZigZag algorithm identifies a 5-point structure (X-A-B-C-D), such as a Gartley, Bat, or Butterfly.
Physics Check:
Finds the last 3 momentum peaks matching the price highs.
Rule: Momentum Peak 2 must be < Peak 1 (Divergence).
Rule: Momentum Peak 3 must be <= Peak 2 (Confirmation/No Div).
Output: Draws the colored pattern and labels it (e.g., "Bearish Gartley (Exhaustion)").
Signal 2: Climax Reversal (Orange Pattern)
Geometry: Identifies the same 5-point structures.
Physics Check:
Rule: Momentum Peak 2 is >= Peak 1 (Strength/No Div).
Rule: Momentum Peak 3 is < Peak 2 (Sudden Failure/Div).
Output: Draws the pattern in Orange labeled "⚠️ CLIMAX REVERSAL". This is your "Trap" detector.
Signal 3: Rounded Top/Bottom (Navy/Maroon Label)
Geometry: Price is compressing or rounding over.
Physics Check:
Scans for 4 consecutive waves of momentum decay.
Rule: Peak 1 > Peak 2 > Peak 3 > Peak 4.
Output: Places a label indicating a "Multi-Wave Decay," identifying turns that don't have sharp pivots.
Signal 4: The Predator (Purple Pattern)
Geometry: Identifies a trend pullback (Higher Low for Buys).
Physics Check:
Rule: Momentum makes a Lower Low while Price makes a Higher Low (Hidden Divergence).
Output: Draws a Purple pattern labeled "🦖 PREDATOR" to signal trend continuation.
3. The Confluence Dashboard
Located in the corner of the screen, this provides a final "Safety Check."
Logic: It compares the absolute value (strength) of the most recent Bearish Momentum Peak vs. the most recent Bullish Momentum Low.
Output:
Green (Bulls Strong): Buying pressure is dominant. Safe to Buy, Dangerous to Sell.
Red (Bears Strong): Selling pressure is dominant. Safe to Sell, Dangerous to Buy.
Grey (Neutral): Forces are balanced.
Summary of Potential
This system solves the "Trader's Dilemma" of entering too early or too late. By waiting for the 3rd Wave, you effectively filter out the market noise and only commit capital when the opposing side has structurally and physically collapsed. It transforms trading from a guessing game into a disciplined execution of identifying Geometric Exhaustion.
Logic 1 / PREVIOUS DIVERGENCE PROJECTS future TREND BREAKS / Reversals *Not in script*
Logic 2 / Wave 1 to 2 = Divergence / Wave 2 to 3 = NO divergence = Signal
Reverse logic: Wave 1 to 2 = NO Divergence / Wave 2 to 3 = Divergence = Signal

MACD Momentum Structure & Volume Profile Sniper [MTF]**Description and Methodology**
This script offers a unique approach to Market Structure by moving away from traditional fractal-based highs and lows (which can be noisy). Instead, it utilizes **MACD Momentum Swings** to identify significant structural points, combined with an automated Fixed Range Volume Profile to pinpoint high-probability entry zones.
**1. Why MACD Structure? (The Core Concept)**
Traditional "ZigZag" or Fractal indicators rely solely on price action, often leading to fake-outs during low-volume consolidation.
* This script defines a "Swing High" only when the MACD Histogram crosses below zero (Momentum shifts Bearish).
* This script defines a "Swing Low" only when MACD crosses above zero (Momentum shifts Bullish).
By linking structure to momentum, we filter out weak price movements and focus on the true "heartbeat" of the trend.
**2. The "Mashup" Synergy: Structure + Volume + Logic**
This is not a random combination of indicators. Each component serves a specific step in the trading execution sequence:
* **Step 1 (Structure):** The script identifies a Change of Character (CHoCH) based on the MACD peaks described above.
* **Step 2 (Liquidity/Value):** When a CHoCH occurs, the script *automatically* draws a **Fixed Range Volume Profile (FRVP)** specifically covering the impulse leg that caused the break. This reveals the "Point of Control" (POC)—the hidden price level where the most volume occurred during the move.
* **Step 3 (The Sniper Entry):** The script creates a "Zone" around that POC. It then waits for Price to retrace into this zone.
* **Step 4 (Confirmation):** Once the zone is touched, the script monitors a lower timeframe (User selectable, default M1) for a fresh MACD crossover to trigger the final entry signal.
**Features**
* **Multi-Timeframe Dashboard:** Monitor the MACD Trend direction across 4 different timeframes simultaneously.
* **Dynamic Trendlines:** Automatically connects confirmed MACD peaks to visualize trend integrity.
* **Fibo Time Zones:** Projects potential future pivot points based on the duration of the previous swing.
* **Alert System:** Integrated alerts for Zone Touches and "Sniper" entries (Zone Touch + LTF Momentum Confirmation).
**How to Use**
1. **Identify Trend:** Look for the CHoCH labels. Green indicates a shift to Bullish, Red to Bearish.
2. **Wait for Pullback:** Do not chase the break. Wait for price to return to the Yellow POC Zone generated by the Volume Profile.
3. **Entry Trigger:** Watch for the "BUY" or "SELL" marks. These appear only when price hits the zone AND the lower-timeframe momentum aligns with the trade direction.
**Settings & Inputs**
* **Global MACD:** Adjust the sensitivity of the swing detection (Default 12, 26, 9).
* **Sniper Entry:** Select the timeframe used for the final confirmation (e.g., use M1 confirmation for an H1 chart structure).
* **VP Settings:** Customize how the Volume Profile looks on the chart.
*Disclaimer: This script is intended for educational purposes and market analysis. It does not provide financial advice.*

A+ Setup Strategy Trendline Features Added:
1. Automatic Trendline Detection
Support Trendline (green) - Connects swing lows
Resistance Trendline (red) - Connects swing highs
Uses pivot points to identify key swing levels
Validates trendlines by counting touches (minimum 3 touches required)
2. Trendline Settings
Show Trendlines - Toggle on/off
Lookback Period - How far back to look for pivots (default: 50 bars)
Min Touches - How many touches needed for valid trendline (default: 3)
3. Trendline Break Detection
Bullish Break - Price breaks above support trendline (marked with small green circle)
Bearish Break - Price breaks below resistance trendline (marked with small red circle)
Generates signals when breaks occur
4. Enhanced A+ Setups
Now includes ULTRA setups - the absolute best trades:
ULTRA BUY Setup (Aqua label):
Bullish FVG + BOS + Volume Spike + Uptrend
PLUS: Support trendline break OR near key support
PLUS: Trendline breakout confirmation
ULTRA SELL Setup (Fuchsia label):
Bearish FVG + BOS + Volume Spike + Downtrend
PLUS: Resistance trendline break OR near key resistance
PLUS: Trendline breakdown confirmation
5. Confluence Integration
The strategy now considers price near trendlines as additional confluence, similar to how it uses daily S/R levels.
6. Additional Alerts
Support Trendline Break
Resistance Trendline Break
ULTRA BUY/SELL Setup alerts
This gives you multiple tiers of signal quality:
Standard A+ Setup - All conditions met
ULTRA A+ Setup - All conditions + trendline break (highest probability)
The trendlines will help you identify major trend reversals and breakouts for even better entry timing!

The Strat Lite [rdjxyz]◆ OVERVIEW
The Strat Lite is a stripped down version of the Strat Assistant indicator by rickyzcarroll—focusing on visual simplicity and script performance. If you're new to The Strat, you may prefer the Strat Assistant as a learning aid.
◇ FEATURES REMOVED FROM THE ORIGINAL SCRIPT
Candle Numbering & Up/Down Arrows
Previous Week High & Low Lines
Previous Day High & Low Lines
Action Wick Percentage
Actionable Signals Plot
Strat Combo Plots
Extensive Alerts
◇ FEATURES KEPT FROM THE ORIGINAL SCRIPT
Full Timeframe Continuity
Candle Coloring
◇ FEATURES ADDED TO THE ORIGINAL SCRIPT
Failed 2 Down Classification
Failed 2 Up Classification
◆ DETAILS
The Strat is a trading methodology developed by Rob Smith that offers an objective approach to trading by focusing on the 3 universal scenarios regarding candle behavior:
SCENARIO ONE
The 1 Bar - Inside Bar: A candle that doesn't take out the highs or the lows of the previous candle; aka consolidation.
These are shown as gray candles by default.
SCENARIO TWO
The 2 Bar - Directional Bar: A candle that takes out one side of the previous candle; aka trending (or at least attempting to trend).
SCENARIO THREE
The 3 Bar - Outside Bar: A candle that takes out both sides of the previous candle; aka broadening formation.
In addition to Rob's 3 universal scenarios, this indicator identifies two variations of 2 bars:
Failed 2 up: A candle that takes out the high of the previous candle but closes bearish.
Failed 2 down: A candle that takes out the low of the previous candle but closes bullish.
◆ SETTINGS
◇ INPUTS
FTC (FULL TIMEFRAME CONTINUITY)
Show/hide FTC plots
Offset FTC plots from current bar
◇ STYLE
STRAT COLORS
Color 0 (Failed 2 Up) - Default is fuchsia
Color 1 (Failed 2 Down) - Default is teal
Color 2 (Inside 1) - Default is gray
Color 3 (Outside 3) - Default is dark purple
Color 4 (2 up) - Default is aqua
Color 5 (2 down) - Default is white
◆ USAGE
It's recommended to use The Strat Lite with a top down analysis so you can find lower timeframe positions with higher timeframe context.
◇ TOP DOWN ANALYSIS
MONTHLY LEVELS
Starting on a monthly chart, the previous month's high and low are manually plotted.
WEEKLY LEVELS
Dropping down to a weekly chart, the previous week's high and low are manually plotted.
DAILY LEVELS
Dropping down to a daily chart, the previous day's high and low are manually plotted.
12H LEVELS
Dropping down to a 12h chart, the previous 12h's high and low are manually plotted.
ANALYSIS
The monthly low was broken, creating a lower low (aka a broadening formation), signalling potential exhaustion risk, which can be a catalyst for reversals. The daily candle that tested the monthly low closed as a Failed 2 Down—potentially an early sign of a reversal. With these 2 confluences, it's reasonable to expect the next daily candle to be a 2 Up. Now it's time to look for a lower timeframe entry.
◇ LOWER TIMEFRAME POSITION
HOURLY PRICE ACTION
Dropping down to an hourly chart, we're anticipating a 2 Up on the daily timeframe, so we're looking for a bullish pattern to enter a position long. I personally like the 6:00 AM UTC-5 hourly candle, as it's the midpoint of the day (for futures).
In this specific example, we see the opening gap was filled and there's a potential 2-1-2 bullish reversal set up.
At this point, price can either do one of 5 things:
Form another 1 (inside) candle
Form a 2 up (directional) candle
Form a 2 down (directional) candle
Form a 2 up, fail, and potentially flip to form a bearish 3 (outside) candle
Form a 2 down, fail, and potentially flip to form a bullish 3 (outside) candle
Knowing the finite potential outcomes helps us set up our positions, manage them accordingly, and flip bias if needed.
POSITION SETUP
Here we can set up a position long AND short. To go long, we set a buy stop at the 1h high and stop loss just below the 50% level of the inside candle; to go short, we set a sell stop at 1h low and stop loss just above the 50% level of the inside candle.
If the short gets triggered first, we can wait for price to move in our favor before cancelling the buy order. If the short becomes a failed 2 down, potentially reversing to become a bullish 3, we can either wait for the stop loss to trigger and for the long position to trigger OR we can move the buy stop to our short stop loss and move the long stop loss to the low of the 1h candle.
POSITION REFINEMENT
For an even tighter risk-to-reward, we can drop to a lower timeframe and look for setups that would be an early trigger of the 1h entry. Just know, the lower you go the more noise there is—increasing risk of getting stopped out before the 1h trigger.
Above are 30m refined entries.
In this example, the long buy stop was triggered. It closed bullish, so the sell stop order can be cancelled.
◇ TARGETS & POSITION MANAGEMENT
TARGETS
These depend on whether you intend to scalp, day trade, or swing trade, but targets are typically the highs of previous candles (when bullish) and lows of previous candles (when bearish). It's advised to be cautious of swing pivots as there's a risk of exhaustion and reversal at these levels.
In this example, the nearest target was the previous 12h high and the next target was the previous day high; if you're a swing trader, you could target previous week's high and previous month's high.
POSITION MANAGEMENT
This largely depends on your risk tolerance, but it's common to either:
Move stop loss slightly into profit
Trail stop loss behind higher highs (bullish) or lower lows (bearish)
Scale out of positions at potential pivot points, leaving a runner
Scale into positions on pullbacks on the way to target
◆ WRAP UP
As demonstrated, The Strat Lite offers a stripped down version of the Strat Assistant—making it visually simple for more experienced Strat traders. By following a top-down approach with The Strat methodology, you can find high probability setups and manage risk with relative ease.
◆ DISCLAIMER
This indicator is a tool for visual analysis and is intended to assist traders who follow The Strat methodology. As with any trading methodology, there's no guarantee of profits; trading involves a high degree of risk and you could lose all of your invested capital. The example shown is of past performance and is not indicative of future results and does not constitute and should not be construed as investment advice. All trading decisions and investments made by you are at your own discretion and risk. Under no circumstances shall the author be liable for any direct, indirect, or incidental damages. You should only risk capital you can afford to lose.

SwiftTrend█ OVERVIEW
SwiftTrend is a trend-following indicator inspired by the classic SuperTrend, but built on a completely different calculation method — using the average candle body size and the body midpoint (bodyMid). It reacts very dynamically to changes in momentum strength. The indicator is clean, easy to read, and perfect for traders who want fast yet confirmed trend direction. By adjusting the settings, you can make signals extremely sensitive or, conversely, reduce their frequency to almost completely eliminate trend flips on minor price moves.
█ CONCEPT
The indicator was created to strike the perfect balance between signal speed and effective noise filtering.
Instead of using classic ATR and price extremes (high/low), SwiftTrend uses the average candle body size and the midpoint of the previous candle’s body as its core reference. The dynamic trend line (avgLine) is protected by a tolerance zone – the trend only changes after price closes beyond this zone. This approach delivers significantly faster reaction times than many traditional solutions while maintaining excellent resistance to false signals during ranging markets.
█ FEATURES
Data source:
- Average candle body size: SMA(|open – close|, period)
- Reference point: midpoint of the previous candle’s body (bodyMid )
Dynamic trend line (avgLine):
- Built using Band Multiplier
- The line is “attracted” toward price movement
Tolerance zone (margin):
- Tolerance = Tolerance Multiplier × avgBody
- Default: 2.5 (for both band and tolerance)
Trend change logic:
- Down → Up: close > avgLine + tolerance
- Up → Down: close < avgLine – tolerance
Visual signals:
- “Buy” label (green upward arrow) and “Sell” label (red downward arrow) only on confirmed trend change
- Optional soft gradient fill between trend line and price
- Optional bar coloring based on current trend
- Trend line with breaks at reversal points
Alerts:
- Buy alert – triggers only when the closing price crosses from below to above the marginLineBase
- Sell alert – triggers only when the closing price crosses from above to below the marginLineBase
█ HOW TO USE
Add to chart → paste the code in Pine Editor or search for “SwiftTrend”.
Main settings:
- Average Body Periods → default 100
- Band Multiplier → default 2.5
- Tolerance Multiplier → default 2.5 (key sensitivity parameter)
- Colors, fill, and bar coloring – fully customizable
Interpretation:
- Green line & shading = uptrend
- Red line & shading = downtrend
- Higher Tolerance Multiplier = fewer but higher-quality signals
- Tolerance Multiplier near 0 = ultra-fast signals (aggressive mode)
█ APPLICATIONS
Excellent for:
- Trend-following (enter with trend, exit on reversal)
- Breakout and momentum strategies
- Filtering consolidation and noise – thanks to the adjustable tolerance zone
Best combined with:
- Classic support/resistance levels
- Fibonacci retracements, Pivot Points, psychological round numbers
- Confirmation from oscillators (RSI, Stochastic, MACD)
- Volume or volume profile analysis
Style adaptation:
- Scalping / daytrading → lower Tolerance Multiplier (0.8–1.8) + shorter period
- Swing / position trading → higher values (2.5–5.0) + longer period
█ NOTES
- Works on all markets and timeframes
- Success depends on matching the Tolerance Multiplier to your strategy and the instrument’s volatility
- Higher multiplier & period values = fewer signals, significantly higher quality
- At Tolerance Multiplier = 0 the indicator becomes extremely responsive – perfect for aggressive momentum trading

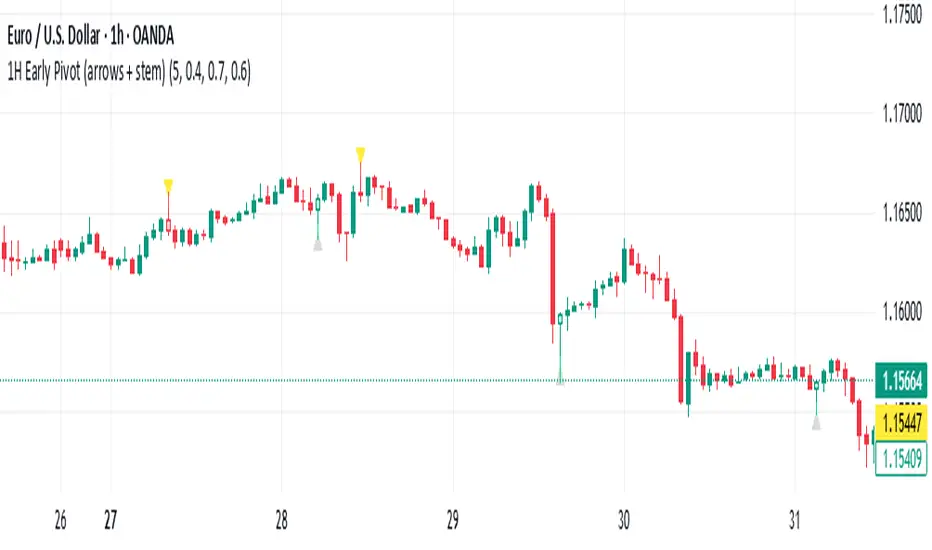
1H Early Pivot (arrows + stem) by Pastor CarrThis indicator helps to find early pivot points on the IH chart.
RSI Trendline Pro - Multi Confirmation
Overview
RSI Trendline Pro is an advanced Pine Script indicator that automatically draws trendlines on the RSI (Relative Strength Index) to detect support and resistance breakouts. It generates high-quality trading signals through a multi-confirmation system.
Key Features
Auto Trendlines: Detects pivot points on RSI to create intelligent support and resistance lines
Multi-Confirmation System: Combines Volume, Stochastic RSI, ADX, and Divergence filters to reduce false signals
RSI Divergence Detection: Automatically identifies bullish/bearish divergences between price and RSI
Live Dashboard: Displays RSI value, active trendlines, ADX strength, and last signal info on a visual panel
Smart Breakout Detection: Identifies trendline breaks and generates LONG/SHORT signals
How to Use
Add to TradingView: Paste code into Pine Editor and add to chart
Configure Parameters:
RSI Length: RSI period (default: 14)
Pivot Strength: Trendline sensitivity (lower = more lines)
Filters: Enable/disable Volume, Divergence, Stoch RSI, and ADX confirmations
Follow Signals:
LONG (Green): When RSI breaks resistance upward
SHORT (Red): When RSI breaks support downward
Divergence: "D" markers indicate potential trend reversals
Alert Setup
Script offers 4 alert types:
LONG Breakout: Resistance break
SHORT Breakout: Support break
Bullish/Bearish Divergence: Divergence detection
Any Signal: Combined alert for all signals
Best Practices
Prioritize high-volume breakouts (Volume Filter enabled)
Trends are stronger when ADX > 25
Confirm divergence signals with price action
Trade when 2-3 confirmations align

Dow Jones Trading System with PivotsThis TradingView indicator, tailored for the 30-minute Dow Jones (^DJI) chart, supports DIA options trading with a trend-following approach. It features a 30-period SMA (blue) and a 60-period SMA (red), with an optional 90-period SMA (orange) drawn from rauItrades' Dow SMA outfit. A bullish crossover (30 SMA > 60 SMA) displays a green "BUY" triangle below the bar for potential DIA longs, while a bearish crossunder (30 SMA < 60 SMA) shows a red "SELL" triangle above for shorts or exits. The background turns green (bullish) or red (bearish) to indicate trend bias. Pivot points highlight recent highs (orange circles) and lows (purple circles) for support/resistance, using a 5-bar lookback. Alerts notify for crossovers.

Dual Table Dashboard - Correct V3add RSI Data## 📈 Trading Applications
### 1. Trend Following Strategy
```
1. Check TABLE 1 for trend direction (AnEMA29 + PDMDR)
2. If both green → Look for longs
3. If both red → Look for shorts
4. Use TABLE 2 for entry levels
```
### 2. Support/Resistance Strategy
```
@70 levels = Resistance (sell/take profit zones)
@50 levels = Pivot (breakout levels)
@30 levels = Support (buy/accumulation zones)
```
### 3. Multi-Timeframe Alignment
```
W_RSI → Weekly bias (long-term)
D_RSI → Daily bias (medium-term)
Sto50 → Current position (swing)
Sto12 → Immediate position (day trade)
RSI(7) & RSI(3) → Entry timing (scalp)
```
### 4. Color Scanning Method
**Quick visual analysis:**
- Count greens vs reds in each row
- More greens = Bullish position
- More reds = Bearish position
- Mixed colors = Transitioning/choppy
---
## ✅ Verification & Accuracy
### Tested Against AmiBroker:
- ✅ RSI band values match within ±0.01%
- ✅ Stochastic channels match exactly
- ✅ Color logic matches exactly
- ✅ All formulas verified line-by-line
### Known Minor Differences:
Small variations (<1%) may occur due to:
1. **Platform calculation precision** - Different floating-point engines
2. **Historical data feeds** - Slight variations in past prices
3. **Weekly bar boundaries** - TradingView vs AmiBroker week definitions
4. **Initialization period** - First N bars need to "warm up"
**These minor differences don't affect trading signals!**
---
## ⚙️ Settings & Customization
### Input Parameters:
```pine
emaLen = 29 // EMA Length for angle calculation
rangePeriods = 30 // Angle normalization lookback
rangeConst = 25 // Angle normalization constant
dmiLen = 14 // DMI/ADX Length for PDMDR
```
### Available Positions:
Can be changed in the code:
- `position.top_left`
- `position.top_center`
- `position.top_right`
- `position.middle_left` (Table 2 default)
- `position.middle_center`
- `position.middle_right`
- `position.bottom_left` (Table 1 default)
- `position.bottom_center`
- `position.bottom_right`
### Text Sizes:
- `size.tiny`
- `size.small` (current default)
- `size.normal`
- `size.large`
- `size.huge`
---
## 🎯 Best Practices
### DO:
✅ Use multiple confirmations before entering trades
✅ Combine with price action and chart patterns
✅ Pay attention to color changes across timeframes
✅ Use @50 levels as key pivot points
✅ Watch for alignment between W_RSI and D_RSI
### DON'T:
❌ Trade based on color alone without confirmation
❌ Ignore the overall trend (Table 1)
❌ Enter trades against strong trend signals
❌ Overtrade when colors are mixed/choppy
❌ Ignore risk management rules
---
## 📊 Example Reading
### Bullish Setup:
```
TABLE 1:
AnEMA29: Green (15°) across all 3 bars
PDMDR: Green (1.65) and rising
TABLE 2:
W_RSI@50: Green (price above)
D_RSI@50: Green (price above)
Sto50@50: Green (price above midpoint)
Sto12@50: Green (price above midpoint)
Interpretation: Strong bullish trend confirmed across multiple timeframes
Action: Look for long entries on pullbacks to @50 or @30 levels
```
### Bearish Setup:
```
TABLE 1:
AnEMA29: Red (-12°) across all 3 bars
PDMDR: Red (0.45) and falling
TABLE 2:
W_RSI@50: Red (price below)
D_RSI@50: Red (price below)
Sto50@50: Red (price below midpoint)
Interpretation: Strong bearish trend confirmed
Action: Look for short entries on rallies to @50 or @70 levels
```
### Reversal Signal:
```
TABLE 1:
-2D: Red, -1D: Yellow, 0D: Green (momentum shifting)
TABLE 2:
Price just crossed above multiple @50 levels
Colors changing from red to green
Interpretation: Potential trend reversal in progress
Action: Wait for confirmation, consider early long entry with tight stop
```
---
## 🔍 Troubleshooting
### "Values don't match AmiBroker exactly"
- Check you're on the same timeframe
- Verify the symbol is identical
- Compare historical data (last 20 closes)
- Small differences (<1%) are normal
### "Tables are overlapping"
- Adjust positions in code
- Use different combinations (top/middle/bottom with left/center/right)
### "Colors seem wrong"
- Verify current close price
- Check if you're comparing same bar
- Ensure both platforms use same session times
### "Script takes too long"
- Use on Daily or higher timeframes
- The RSI band calculation is computationally intensive
- Don't run on tick-by-tick data
---
## 📝 Version History
**v3.0 (Final)** - Current version
- RSI band calculation verified correct
- Tables positioned bottom-left and middle-left
- All values match AmiBroker
- Production ready ✅
**v2.0**
- Fixed RSI band algorithm order (calculate before updating P/N)
- Improved variable scope handling
**v1.0**
- Initial implementation
- Had incorrect RSI band calculation
---
## 📄 Files in Package

ZS Game Changer Pump & Dump DetectorZS GAME CHANGER PUMP AND DUMP DETECTOR - TOP 2 MOMENTUM TRACKER
Created by Zakaria Safri
An intelligent indicator specifically designed to identify and highlight the two most significant pump and dump candles within your selected lookback period. Perfect for traders who want to focus on the game-changing moves that truly matter in volatile markets like cryptocurrency, stocks, and forex.
CORE FEATURES
AUTOMATIC GAME CHANGER DETECTION
The indicator continuously scans your specified lookback period and automatically identifies the top 2 strongest pump candles and top 2 strongest dump candles. These game-changing candles are highlighted with distinctive gold labels and horizontal reference lines, making them instantly visible on your chart. Unlike other indicators that show every small move, this focuses exclusively on the market-moving moments that define trends and create opportunities.
INTELLIGENT PUMP AND DUMP CLASSIFICATION
Uses advanced percentage-based calculations to classify candles as pumps when price surges significantly upward and dumps when price plunges sharply downward. The detection system accounts for candle body size, wick proportions, and volume confirmation to ensure only legitimate momentum moves trigger signals. Customizable thresholds allow adaptation to any market volatility profile from calm stocks to wild altcoins.
ADVANCED WICK EXCLUSION FILTER
Eliminates false signals caused by candles with large wicks and small bodies. This filter focuses analysis exclusively on candles with substantial body sizes that indicate genuine directional conviction rather than temporary spikes followed by rejection. The body to candle ratio is fully adjustable to match your preferred signal quality standards.
VOLUME CONFIRMATION SYSTEM
Optional volume filter ensures detected pumps and dumps are backed by real market participation. The indicator compares current volume against a moving average and only triggers signals when volume exceeds your specified multiplier threshold. This eliminates low-volume noise and focuses on moves supported by institutional or crowd participation.
RALLY SEQUENCE DETECTION
Identifies and highlights consecutive sequences of pump or dump candles with colored background overlays. Green background indicates sustained buying pressure across multiple candles while red background shows sustained selling pressure. The rally detection system includes an optional one-miss allowance that prevents the sequence from breaking due to a single neutral candle.
HORIZONTAL REFERENCE LINES
Draws dashed lines from each game changer candle extending to the current bar, providing constant visual reference to the most significant support and resistance levels created by extreme momentum. The top game changer gets a thick dashed line while the second gets a dotted line for easy differentiation. Labels on the right side display the exact percentage move.
COMPREHENSIVE STATISTICS DASHBOARD
Real-time information panel showing current market status as pumping, dumping, or neutral along with the current candle percentage change. Displays the exact percentage values for top pump number 1, top pump number 2, top dump number 1, and top dump number 2. Shows running totals of all pumps and dumps detected since chart load. Tracks consecutive candle counts during active rally sequences.
TESTING AND VERIFICATION MODE
Built-in debug mode displays percentage change directly on each qualifying pump and dump candle, allowing instant verification that calculations are accurate. Shows which filters are currently active with a simple code in the dashboard. Helps traders understand exactly why certain candles qualified as game changers.
HOW THE GAME CHANGER DETECTION WORKS
SCANNING ALGORITHM
Every bar close, the indicator scans backward through your specified lookback period examining every candle's percentage change from its previous close. For bullish moves, it identifies the two candles with the largest positive percentage change that meet your threshold requirements. For bearish moves, it identifies the two candles with the largest negative percentage change meeting threshold requirements.
RANKING SYSTEM
Candles are ranked purely by their percentage move magnitude. The number 1 game changer is always the single strongest move in the lookback period. The number 2 game changer is the second strongest move. Rankings update dynamically as new candles form and old candles exit the lookback window.
VISUAL IDENTIFICATION
Game changer number 1 for both pumps and dumps receives a large gold label reading GAME CHANGER NUMBER 1 with zero transparency for maximum visibility. Game changer number 2 receives a slightly smaller gold label with partial transparency. The candle bars themselves are colored in gold instead of the standard green or red. Horizontal lines extend from the game changer price level to current bar.
FILTER APPLICATION
Only candles that pass your configured filters qualify for game changer consideration. If wick exclusion is enabled, candles with large wicks and small bodies are ignored. If volume confirmation is enabled, only candles with above-average volume qualify. This ensures game changers represent legitimate market moves rather than aberrations.
PRACTICAL APPLICATIONS
FOR CRYPTOCURRENCY TRADERS
Crypto markets experience extreme volatility with occasional massive pump and dump candles that define entire trends. This indicator instantly identifies which candles represent true market structure shifts versus normal noise. Use the game changer levels as key support and resistance for entries, exits, and stop placement. The top pump often marks the local high to watch for breakouts while the top dump marks the local low for reversal trades.
FOR DAY TRADERS
Intraday charts contain hundreds of candles but only a few truly matter for the session outcome. Game changer detection filters out 98 percent of candles to show you the 2 percent that drove the actual price movement. Enter trades on the side of the strongest recent game changer. Use game changer levels as magnet prices where algorithmic trading often returns.
FOR SWING TRADERS
On daily and four-hour timeframes, game changers represent major institutional activity or news-driven moves. The top dump often marks capitulation selling that creates reversal opportunities. The top pump often marks FOMO buying that creates resistance levels. Swing traders can build positions knowing these levels will be defended or tested multiple times.
FOR VOLATILITY ANALYSIS
Understanding which candles created the most volatility helps assess market risk. Multiple game changers clustered together indicate unstable choppy conditions. Game changers separated by many neutral candles indicate trending stable conditions. Use this context to adjust position sizing and stop distances appropriately.
FOR SUPPORT AND RESISTANCE TRADING
Game changer candles create the strongest support and resistance levels because they represent prices where massive volume transacted in short time periods. These levels have higher probability of holding on retest compared to arbitrary moving averages or pivot points. Trade bounces off game changer levels or breakouts through them.
RECOMMENDED SETTINGS BY MARKET
CRYPTOCURRENCY 15-MINUTE TO 1-HOUR CHARTS
Candle Size Threshold: 2.0 percent
Body to Candle Ratio: 0.5
Volume Multiplier: 1.5 times average
Game Changer Lookback: 100 bars
Extreme Threshold: 3.5 percent
Enable Wick Filter: Yes
Enable Volume Confirmation: Yes
Minimum Rally Candles: 3
STOCKS DAILY CHARTS
Candle Size Threshold: 1.0 percent
Body to Candle Ratio: 0.6
Volume Multiplier: 2.0 times average
Game Changer Lookback: 50 bars
Extreme Threshold: 2.5 percent
Enable Wick Filter: Yes
Enable Volume Confirmation: Yes
Minimum Rally Candles: 2
FOREX 1-HOUR TO 4-HOUR CHARTS
Candle Size Threshold: 0.5 percent
Body to Candle Ratio: 0.5
Volume Multiplier: Not applicable
Game Changer Lookback: 80 bars
Extreme Threshold: 1.0 percent
Enable Wick Filter: Yes
Enable Volume Confirmation: No
Minimum Rally Candles: 3
SCALPING 1-MINUTE TO 5-MINUTE CHARTS
Candle Size Threshold: 0.8 percent
Body to Candle Ratio: 0.4
Volume Multiplier: 1.2 times average
Game Changer Lookback: 50 bars
Extreme Threshold: 1.5 percent
Enable Wick Filter: No
Enable Volume Confirmation: Yes
Minimum Rally Candles: 2
WHAT IS INCLUDED
Automatic identification of top 2 pump candles
Automatic identification of top 2 dump candles
Gold colored game changer labels with size differentiation
Gold colored candle bars for game changers
Horizontal reference lines from game changers to current price
Regular pump and dump detection with green and red candles
Rally sequence detection with background highlighting
Extreme move detection and labeling system
Real-time statistics dashboard with all key metrics
Percentage change debug mode for verification
Volume confirmation filter with adjustable multiplier
Wick exclusion filter with adjustable body ratio
Customizable lookback period from 20 to 500 bars
Consecutive candle counter for rally tracking
Alert system for game changers, pumps, dumps, and rallies
Works on all timeframes from 1 minute to monthly
Compatible with stocks, forex, cryptocurrency, and futures
UNDERSTANDING GAME CHANGERS
WHAT MAKES A CANDLE A GAME CHANGER
A game changer is not just a large move but the largest move within context. In a volatile crypto market, a 5 percent pump might not rank in the top 2. In a stable stock, a 2 percent pump could be the number 1 game changer. The indicator adapts to your specific instrument and timeframe to find what truly matters in that context.
WHY FOCUS ON TOP 2 ONLY
Markets are driven by a small number of significant moves rather than the average of all moves. By focusing exclusively on the top 2 in each direction, traders can ignore noise and concentrate on the price levels that actually matter for support, resistance, and momentum. This creates clarity in decision making.
GAME CHANGERS AS MARKET STRUCTURE
The top pump often marks the recent high that bulls must break to continue uptrend. The top dump often marks the recent low that bears must break to continue downtrend. These become the key levels around which all other price action rotates. Understanding this structure is essential for profitable trading.
GAME CHANGERS AS SENTIMENT INDICATORS
Consecutive pump game changers signal strong bullish sentiment and FOMO conditions. Consecutive dump game changers signal fear and capitulation. Alternating pump and dump game changers signal indecision and range conditions. Read the pattern of game changers to gauge market psychology.
VERIFICATION AND TESTING
HOW TO VERIFY ACCURACY
Enable Show Debug Info on Chart in the Testing and Debug settings group. This displays the percentage change calculation directly on every qualifying pump and dump candle. Manually verify by calculating open minus close divided by close multiplied by 100. The debug percentage should match your manual calculation exactly.
HOW TO TEST FILTERS
Toggle wick exclusion filter on and off while watching how many candles qualify. With filter on, candles with long wicks and small bodies should disappear. Toggle volume confirmation on and off to see how low-volume candles get excluded. Adjust the thresholds and watch the real-time impact on signal count.
HOW TO VERIFY GAME CHANGERS
Look at your chart and visually identify which candle had the biggest green body in the lookback period. The game changer number 1 pump label should be on that exact candle. Repeat for the biggest red candle to verify game changer number 1 dump. The rankings should match your visual assessment.
LOOKBACK PERIOD EFFECTS
Decrease the lookback period to 20 bars and watch game changers update to only recent moves. Increase to 500 bars and watch game changers potentially change to older historic moves. The optimal lookback balances recency with significance. Too short misses important levels, too long includes irrelevant history.
DASHBOARD INFORMATION GUIDE
STATUS ROW
Shows PUMPING when current candle qualifies as a pump, DUMPING when current candle qualifies as a dump, or NEUTRAL when current candle does not meet threshold requirements. This updates in real-time on every bar close.
CURRENT CHANGE ROW
Displays the percentage change of the current candle from its previous close. Positive percentages indicate bullish candle, negative indicate bearish candle. This number may or may not meet your threshold to qualify as pump or dump.
TOP PUMP NUMBER 1
The highest positive percentage change found in your lookback period. This candle is marked with the large gold GAME CHANGER NUMBER 1 label below it. Shows N/A if no pumps exist in the lookback period.
TOP PUMP NUMBER 2
The second highest positive percentage change found in your lookback period. Marked with smaller gold GAME CHANGER NUMBER 2 label. Shows N/A if only one or zero pumps exist.
TOP DUMP NUMBER 1
The highest negative percentage change magnitude found in your lookback period. This candle is marked with the large gold GAME CHANGER NUMBER 1 label above it. Shows N/A if no dumps exist.
TOP DUMP NUMBER 2
The second highest negative percentage change magnitude found in your lookback period. Marked with smaller gold GAME CHANGER NUMBER 2 label. Shows N/A if only one or zero dumps exist.
TOTAL PUMPS
Running count of all pump candles detected since you loaded the indicator on this chart. This number continuously increases as new qualifying pumps form. Resets when you reload the chart.
TOTAL DUMPS
Running count of all dump candles detected since chart load. Increases as new qualifying dumps form and resets on chart reload.
CONSECUTIVE
Shows the current count of consecutive pump or dump candles during an active rally. Displays 3 UP during a 3-candle pump rally or 5 DN during a 5-candle dump rally. Shows 0 when no rally is active.
ALERT SYSTEM
GAME CHANGER DETECTED ALERT
Triggers whenever the current candle becomes one of the top 2 pumps or top 2 dumps. This is the highest priority alert indicating a market-moving event just occurred. Use this alert for immediate notification of significant opportunities.
PUMP DETECTED ALERT
Triggers on every candle that qualifies as a pump according to your threshold and filter settings. This includes regular pumps and extreme pumps but excludes game changers which have their separate alert. Use for general upward momentum monitoring.
DUMP DETECTED ALERT
Triggers on every candle that qualifies as a dump according to your settings. Includes regular and extreme dumps but excludes game changers. Use for general downward momentum monitoring.
PUMP RALLY STARTED ALERT
Triggers when consecutive pump candles reach your minimum rally threshold. Indicates the beginning of a sustained upward movement sequence. Use to catch trends early.
DUMP RALLY STARTED ALERT
Triggers when consecutive dump candles reach your minimum rally threshold. Indicates the beginning of a sustained downward movement sequence. Use for trend following or reversal timing.
ALERT MESSAGE FORMAT
All alerts include the ticker symbol and current price using TradingView placeholders. Messages are descriptive and specify which type of signal triggered. Alerts work with TradingView notification system including email, SMS, webhook, and app notifications.
TECHNICAL SPECIFICATIONS
CALCULATION METHODOLOGY
Percentage change calculated as current close minus previous close divided by previous close multiplied by 100. Body ratio calculated as absolute value of close minus open divided by high minus low. Volume elevation calculated as current volume divided by 20-period simple moving average of volume. Game changer ranking uses absolute value comparison across entire lookback array.
PERFORMANCE CHARACTERISTICS
Lightweight calculations optimized for speed on all timeframes. No repainting of signals ensuring all triggers are final on bar close. Variables properly scoped with var keyword for memory efficiency. Maximum bars back set to 500 to prevent excessive historical loading. Updates in real-time on every bar close without lag.
COMPATIBILITY
Works on all TradingView plans including free, pro, and premium. Compatible with stocks, forex, cryptocurrency, futures, indices, and commodities. Functions correctly on all timeframes from 1 second to monthly. No external data requests ensuring fast loading. Overlay true setting places directly on price chart.
RISK DISCLAIMER
This indicator is a technical analysis tool for identifying momentum and should not be used as the sole basis for trading decisions. Game changer levels can be broken during strong trends and are not guaranteed support or resistance. Pump and dump detection does not predict future price direction. Always use proper risk management with stop losses on every trade. Combine this indicator with other forms of analysis including fundamentals, market context, and risk assessment. Practice on demo accounts before live trading. Past performance of game changer signals does not guarantee future results. Trading carries substantial risk of loss and is not suitable for all investors. The creator is not responsible for trading losses incurred while using this tool.
SUPPORT AND UPDATES
Regular updates based on user feedback and market evolution. Built following PineCoders industry standards and best practices for code quality. Clean well-documented code structure for transparency and auditability. Optimized performance across all timeframes and instruments. Active development with continuous improvements and feature additions.
WHY CHOOSE ZS GAME CHANGER PUMP AND DUMP DETECTOR
Focuses on what matters by highlighting only the top 2 moves in each direction instead of cluttering your chart with every small fluctuation. Saves time by automatically identifying the most significant candles rather than requiring manual scanning. Provides clarity through visual gold labels and reference lines that make game changers unmistakable. Adapts to any market with customizable thresholds for volatility and volume. Eliminates noise with advanced wick and volume filters ensuring signal quality. Offers verification through debug mode proving calculations are accurate and trustworthy. Includes comprehensive statistics showing exact percentages and counts. Works everywhere across all markets, timeframes, and instruments without modification.
Transform your chart analysis by focusing exclusively on the game-changing moments that define trends and create opportunities.
Version 1.1 | Created by Zakaria Safri | Pine Script Version 5 | PineCoders Compliant

Daily Pivot Points - Fixed Until Next Day(GeorgeFutures)We have a pivot point s1,s2,s3 and r1,r2,r3 base on calcul matematics

Advanced Pattern Detection System [50+ Patterns]【Advanced Pattern Detection System - Auto-detects 50+ Chart Patterns】
Introducing the most powerful pattern detection indicator for TradingView!
◆ What is this?
An automated tool that finds and displays over 50 chart patterns on your charts. It detects all the patterns professional traders use - Double Tops, Triangles, Head & Shoulders, and more - all in ONE indicator.
◆ Main Features
・Detects 50+ patterns in real-time
・Shows visual explanation of WHY each pattern was identified
・Automatically calculates theoretical target prices
・Displays confidence levels in % (60-95%)
・Choose panel position from 9 locations
・Works on all timeframes (1min to Monthly)
◆ Detectable Patterns
1. Classic Patterns (Double Top/Bottom, Head & Shoulders, etc.)
2. Triangle Patterns (Ascending, Descending, Symmetrical, Expanding)
3. Continuation Patterns (Flags, Pennants, Wedges, etc.)
4. Harmonic Patterns (Gartley, Butterfly, Bat, etc.)
5. Price Action (Pin Bar, Engulfing, Hammer, etc.)
6. Special Patterns (Cup & Handle, V-formations, etc.)
◆ What Makes It Different
・Not just detection - shows the reasoning behind it
・Auto-draws pivot points and necklines
・Displays target prices with % gain/loss from current price
・Detects multiple patterns simultaneously, sorted by confidence
・Available in both Japanese and English versions
◆ Perfect For
✓ Anyone tired of using multiple indicators
✓ Beginners wanting to learn pattern trading
✓ Traders who don't want to miss entry points
✓ Those looking to improve discretionary trading accuracy
◆ How to Use (Easy 3 Steps)
1. Open TradingView and paste code in Pine Editor
2. Click "Add to Chart"
3. Enable only the patterns you need in settings
◆ Color Meanings
Green → Bullish potential (Buy signal)
Red → Bearish potential (Sell signal)
Yellow → Neutral direction (Wait and see)
◆ Recommended Settings
Scalping: Detection period 20, Sensitivity 0.0025
Day Trading: Detection period 50, Sensitivity 0.002
Swing Trading: Detection period 100, Sensitivity 0.0015
◆ Real Trading Example
"Detects Double Bottom → 85% confidence → Enter on neckline break → Take profit at displayed target price"
This is how you can use it in practice.
◆ Important Notes
・This is an analysis tool, not investment advice
・Always combine with other indicators
・Always set stop losses
・Practice on demo account before live trading
◆ Performance
If running slow, turn OFF unused pattern categories. Reducing max display count to 3 also helps.
◆ Summary
This single tool provides functionality that would normally require multiple paid indicators (worth $100-200 total). It's the ultimate pattern detection system recommended for all traders, from beginners to professionals.
Give it a try if interested! Feel free to ask questions in the comments.

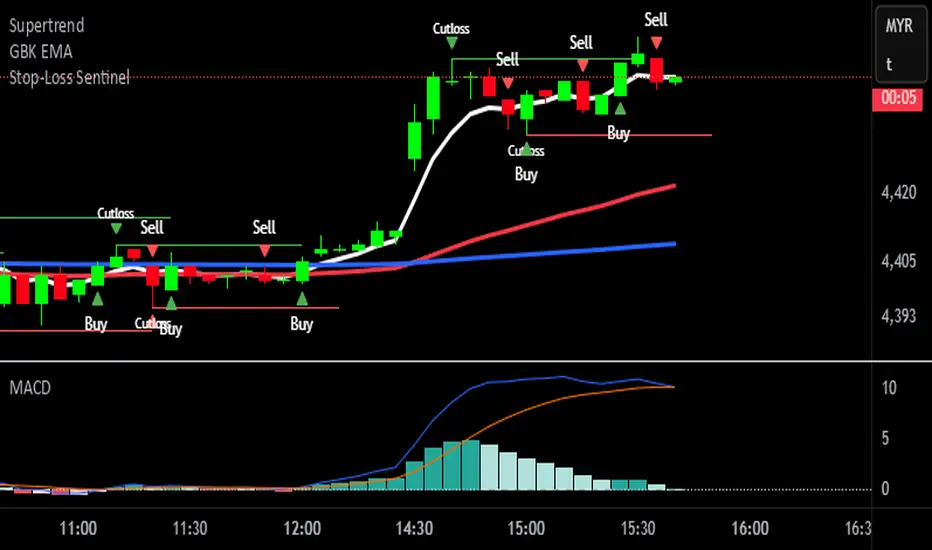
Stop-Loss Sentinel
Cutloss Swing Marker with Adjustable Trend Lines
This indicator identifies swing highs and lows using pivot points.
Swing Highs are marked with a green downward triangle and a "Cutloss" label above the bar.
Swing Lows are marked with a red upward triangle and a "Cutloss" label below the bar.
From each Cutloss point, a horizontal trend line is drawn forward for a set number of bars.
All colors (text, trend lines) and line length are fully adjustable in the settings.
Intended Use:
Helps traders visually mark potential stop-loss or reversal zones and track them over the next few bars. Works on any timeframe, but is designed for fast decision-making on lower timeframes like M1.
Marks key swing highs/lows with ‘Cutloss’ labels and triangles, then extends customizable trend lines for the next bars. Ideal for spotting stop-loss or reversal zones on any timeframe.
Market Regime Matrix [Alpha Extract]A sophisticated market regime classification system that combines multiple technical analysis components into an intelligent scoring framework to identify and track dominant market conditions. Utilizing advanced ADX-based trend detection, EMA directional analysis, volatility assessment, and crash protection protocols, the Market Regime Matrix delivers institutional-grade regime classification with BULL, BEAR, and CHOP states. The system features intelligent scoring with smoothing algorithms, duration filters for stability, and structure-based conviction adjustments to provide traders with clear, actionable market context.
🔶 Multi-Component Regime Engine Integrates five core analytical components: ADX trend strength detection, EMA-200 directional bias, ROC momentum analysis, Bollinger Band volatility measurement, and zig-zag structure verification. Each component contributes to a sophisticated scoring system that evaluates market conditions across multiple dimensions, ensuring comprehensive regime assessment with institutional precision.
// Gate Keeper: ADX determines market type
is_trending = adx_value > adx_trend_threshold
is_ranging = adx_value <= adx_trend_threshold
is_maximum_chop = adx_value <= adx_chop_threshold
// BULL CONDITIONS with Structure Veto
if price_above_ema and di_bullish
if use_structure_filter and isBullStructure
raw_bullScore := 5.0 // MAXIMUM CONVICTION: Strong signals + Bull structure
else if use_structure_filter and not isBullStructure
raw_bullScore := 3.0 // REDUCED: Strong signals but broken structure
🔶 Intelligent Scoring System Employs a dynamic 0-5 scale scoring mechanism for each regime type (BULL/BEAR/CHOP) with adaptive conviction levels. The system automatically adjusts scores based on signal alignment, market structure confirmation, and volatility conditions. Features decision margin requirements to prevent false regime changes and includes maximum conviction thresholds for high-probability setups.
🔶 Advanced Structure Filter Implements zig-zag based market structure analysis using configurable deviation thresholds to identify significant pivot points. The system tracks Higher Highs/Higher Lows (HH/HL) for bullish structure and Lower Lows/Lower Highs (LL/LH) for bearish structure, applying structure veto logic that reduces conviction when price action contradicts the underlying trend framework.
// Define Market Structure (Bull = HH/HL, Bear = LL/LH)
isBullStructure = not na(last_significant_high) and not na(prev_significant_high) and
not na(last_significant_low) and not na(prev_significant_low) and
last_significant_high > prev_significant_high and last_significant_low > prev_significant_low
isBearStructure = not na(last_significant_high) and not na(prev_significant_high) and
not na(last_significant_low) and not na(prev_significant_low) and
last_significant_low < prev_significant_low and last_significant_high < prev_significant_high
🔶 Superior Engine Components Features dual-layer regime stabilization through score smoothing and duration filtering. The score smoothing component reduces noise by averaging raw scores over configurable periods, while the duration filter requires minimum regime persistence before confirming changes. This eliminates whipsaws and ensures regime transitions represent genuine market shifts rather than temporary fluctuations.
🔶 Crash Detection & Active Penalties Incorporates sophisticated crash detection using Rate of Change (ROC) analysis with severity classification. When crash conditions are detected, the system applies active penalties (-5.0) to BULL and CHOP scores while boosting BEAR conviction based on crash severity. This ensures immediate regime response to major market dislocations and drawdown events.
// === CRASH OVERRIDE (Active Penalties) ===
is_crash = roc_value < crash_threshold
if is_crash
// Calculate crash severity
crash_severity = math.abs(roc_value / crash_threshold)
crash_bonus = 4.0 + (crash_severity - 1.0) * 2.0
// ACTIVE PENALTIES: Force bear dominance
raw_bearScore := math.max(raw_bearScore, crash_bonus)
raw_bullScore := -5.0 // ACTIVE PENALTY
raw_chopScore := -5.0 // ACTIVE PENALTY
❓How It Works
🔶 ADX-Based Market Classification The Market Regime Matrix uses ADX (Average Directional Index) as the primary gatekeeper to distinguish between trending and ranging market conditions. When ADX exceeds the trend threshold, the system activates BULL/BEAR regime logic using DI+/DI- crossovers and EMA positioning. When ADX falls below the ranging threshold, CHOP regime logic takes precedence, with maximum conviction assigned during ultra-low ADX periods.
🔶 Dynamic Conviction Scaling Each regime receives conviction ratings from UNCERTAIN to MAXIMUM based on signal alignment and score magnitude. MAXIMUM conviction (5.0 score) requires perfect signal alignment plus favorable market structure. The system progressively reduces conviction when signals conflict or structure breaks, ensuring traders understand the reliability of each regime classification.
🔶 Regime Transition Management Implements decision margin requirements where new regimes must exceed existing regimes by configurable thresholds before transitions occur. Combined with duration filtering, this prevents premature regime changes and maintains stability during consolidation periods. The system tracks both raw regime signals and final regime output for complete transparency.
🔶 Visual Regime Mapping Provides comprehensive visual feedback through colored candle overlays, background regime highlighting, and real-time information tables. The system displays regime history, conviction levels, structure status, and key metrics in an organized dashboard format. Regime changes trigger immediate visual alerts with detailed transition information.
🔶 Performance Optimization Features efficient array management for zig-zag calculations, smart variable updating to prevent recomputation, and configurable debug modes for strategy development. The system maintains optimal performance across all timeframes while providing institutional-grade analytical depth.
Why Choose Market Regime Matrix ?
The Market Regime Matrix represents the evolution of market regime analysis, combining traditional technical indicators with modern algorithmic decision-making frameworks. By integrating multiple analytical dimensions with intelligent scoring, structure verification, and crash protection, it provides traders with institutional-quality market context that adapts to changing conditions. The sophisticated filtering system eliminates noise while preserving responsiveness, making it an essential tool for traders seeking to align their strategies with dominant market regimes and avoid adverse market environments.

BuySell-byALHELWANI🔱 BuySell-byALHELWANI | مؤشر التغيرات الاتجاهية الذكية
BuySell-byALHELWANI هو مؤشر احترافي متقدّم يرصد نقاط الانعكاس الحقيقية في حركة السوق، باستخدام خوارزمية تعتمد على تحليل القمم والقيعان الهيكلية للسعر (Structure-Based Detection) وليس على مؤشرات تقليدية.
المؤشر مبني على مكتبة signalLib_yashgode9 القوية، مع تخصيص كامل لأسلوب العرض والتنبيهات.
⚙️ ما يقدمه المؤشر:
🔹 إشارات واضحة للشراء والبيع تعتمد على كسر هيكل السوق.
🔹 تخصيص مرن للعمق والانحراف وخطوات التراجع (Backstep) لتحديد الدقة المطلوبة.
🔹 علامات ذكية (Labels) تظهر مباشرة على الشارت عند كل نقطة قرار.
🔹 تنبيهات تلقائية فورية عند كل تغير في الاتجاه (Buy / Sell).
🧠 الآلية المستخدمة:
DEPTH_ENGINE: يتحكم في مدى عمق النظر لحركة السعر.
DEVIATION_ENGINE: يحدد المسافة المطلوبة لتأكيد نقطة الانعكاس.
BACKSTEP_ENGINE: يضمن أن كل إشارة تستند إلى تغير هيكلي حقيقي في الاتجاه.
📌 المميزات:
✅ لا يعيد الرسم (No Repaint)
✅ يعمل على كل الأطر الزمنية وكل الأسواق (فوركس، مؤشرات، كريبتو، أسهم)
✅ تصميم بصري مرن (ألوان، حجم، شفافية)
✅ يدعم الاستخدام في السكالبينغ والسوينغ
ملاحظة:
المؤشر لا يعطي إشارات عشوائية، بل يستند إلى منطق السعر الحقيقي عبر تتبع التغيرات الحركية للسوق.
يُفضّل استخدامه مع خطة تداول واضحة وإدارة رأس مال صارمة.
🔱 BuySell-byALHELWANI | Smart Reversal Detection Indicator
BuySell-byALHELWANI is a high-precision, structure-based reversal indicator designed to identify true directional shifts in the market. Unlike traditional indicators, it doesn't rely on lagging oscillators but uses real-time swing analysis to detect institutional-level pivot points.
Powered by the robust signalLib_yashgode9, this tool is optimized for traders who seek clarity, timing, and strategic control.
⚙️ Core Engine Features:
🔹 Accurate Buy/Sell signals generated from structural highs and lows.
🔹 Adjustable sensitivity using:
DEPTH_ENGINE: Defines how deep the algorithm looks into past swings.
DEVIATION_ENGINE: Sets the deviation required to confirm a structural change.
BACKSTEP_ENGINE: Controls how many bars are validated before confirming a pivot.
🧠 What It Does:
🚩 Detects market structure shifts and confirms them visually.
🏷️ Plots clear Buy-point / Sell-point labels directly on the chart.
🔔 Sends real-time alerts when a directional change is confirmed.
🎯 No repainting – what you see is reliable and final.
✅ Key Benefits:
Works on all timeframes and all asset classes (FX, crypto, indices, stocks).
Fully customizable: colors, label size, transparency.
Ideal for scalping, swing trading, and strategy automation.
High visual clarity with minimal noise.
🔐 Note:
This script is designed for serious traders.
It highlights real market intent, especially when used with trendlines, zones, and volume analysis.
Pair it with disciplined risk management for best results.

Contrarian Market Structure BreakMarket Structure Break application was inspired and adapted from Market Structure Oscillator indicator developed by Lux Algo. So much credit to their work.
This indicator pairs nicely with the Contrarian 100 MA and can be located here:
Indicator Description: Contrarian Market Structure BreakOverview
The "Contrarian Market Structure Break" indicator is a versatile tool tailored for traders seeking to identify potential reversal opportunities by analyzing market structure across multiple timeframes. Built on Institutional Concepts of Structure (ICT), this indicator detects Break of Structure (BOS) and Change of Character (CHoCH) patterns across short-term, intermediate-term, and long-term swings, plotting them with customizable lines and labels. It generates contrarian buy and sell signals when price breaks key swing levels, with a unique "Blue Dot Tracker" to monitor consecutive buy signals for trend confirmation. Optimized for the daily timeframe, this indicator is adaptable to other timeframes with proper testing, making it ideal for traders of forex, stocks, or cryptocurrencies.
How It Works
The indicator combines three key components to provide a comprehensive view of market dynamics: Multi-Timeframe Market Structure Analysis: It identifies swing highs and lows across short-term, intermediate-term, and long-term periods, plotting BOS (continuation) and CHoCH (reversal) events with customizable line styles and labels.
Contrarian Signal Generation: Buy and sell signals are triggered when the price crosses below swing lows (buy) or above swing highs (sell), indicating potential reversals in overextended markets.
Blue Dot Tracker: A unique feature that counts consecutive buy signals ("blue dots") and highlights a "Hold Investment" state with a yellow background when three or more buy signals occur, suggesting a potential trend continuation.
Signals are visualized as small circles below (buy) or above (sell) price bars, and a table in the bottom-right corner displays the blue dot count and recommended action (Hold or Flip Investment), enhancing decision-making clarity.
Mathematical Concepts Swing Detection: The indicator identifies swing highs and lows by comparing price patterns over three bars, ensuring robust detection of pivot points. A swing high occurs when the middle bar’s high is higher than the surrounding bars, and a swing low occurs when the middle bar’s low is lower.
Market Structure Logic: BOS is detected when the price breaks a prior swing high (bullish) or low (bearish) in the direction of the current trend, while CHoCH signals a potential reversal when the price breaks a swing level against the trend. These are calculated across three timeframes for a multi-dimensional perspective.
Blue Dot Tracker: This feature counts consecutive buy signals and tracks the entry price. If three or more buy signals occur without a sell signal, the indicator enters a "Hold Investment" state, marked by a yellow background, until the price exceeds the entry price or a sell signal occurs.
Entry and Exit Rules Buy Signal (Blue Dot Below Bar): Triggered when the closing price crosses below a swing low on either the intermediate-term or long-term timeframe, suggesting an oversold condition and potential reversal upward. Short-term signals can be enabled but are disabled by default to reduce noise.
Sell Signal (White Dot Above Bar): Triggered when the closing price crosses above a swing high on either the intermediate-term or long-term timeframe, indicating an overbought condition and potential reversal downward.
Blue Dot Tracker Logic: After a buy signal, the indicator increments a blue dot counter and records the entry price. If three or more consecutive buy signals occur (blueDotCount ≥ 3), the indicator enters a "Hold Investment" state, highlighted with a yellow background, suggesting a potential trend continuation. The "Hold Investment" state ends when the price exceeds the entry price or a sell signal occurs, resetting the counter.
Exit Rules: Traders can exit buy positions when a sell signal appears, the price exceeds the entry price during a "Hold Investment" state, or based on additional confirmation from BOS/CHoCH patterns or other technical analysis tools. Always use proper risk management.
Recommended Usage
The indicator is optimized for the daily timeframe, where it effectively captures significant reversal and continuation patterns in trending or ranging markets. It can be adapted to other timeframes (e.g., 1H, 4H, 15M) with careful testing of settings, particularly enabling/disabling short-term structure analysis to suit market conditions. Backtesting is recommended to optimize performance for your chosen asset and timeframe.
Customization Options Market Structure Display: Toggle short-term, intermediate-term, and long-term structures on or off, with customizable line styles (solid, dashed, dotted) and colors for bullish and bearish breaks.
Labels: Enable or disable BOS/CHoCH labels for each timeframe to reduce chart clutter.
Signal Visibility: Hide buy/sell signals if desired for a cleaner chart.
Blue Dot Tracker: Monitor the blue dot count and action (Hold or Flip Investment) via the table display, which is fully customizable in terms of position and appearance.
Why Use This Indicator?
The "Contrarian Market Structure Break" indicator offers a robust framework for identifying high-probability reversal and continuation setups using ICT principles. Its multi-timeframe analysis, clear signal visualization, and innovative Blue Dot Tracker provide traders with actionable insights into market dynamics. Whether you're a swing trader or a day trader, this indicator’s flexibility and intuitive design make it a valuable addition to your trading arsenal.
Note for TradingView Moderators
This script complies with TradingView's House Rules by providing an educational and transparent description without performance claims or guarantees. It is designed to assist traders in technical analysis and should be used alongside proper risk management and personal research. The code is original, well-documented, and includes customizable inputs and clear visual outputs to enhance the user experience.
Tips for Users:
Backtest thoroughly on your chosen asset and timeframe to validate signal reliability. Combine with other indicators or price action analysis for confirmation of entries and exits. Adjust timeframe settings and enable/disable short-term structures to match market volatility and your trading style.
Hope the "Contrarian Market Structure Break" indicator enhances your trading strategy and helps you navigate the markets with confidence! Happy trading!

Dkoderweb repainting issue fix strategyHarmonic Pattern Recognition Trading Strategy
This TradingView strategy called "Dkoderweb repainting issue fix strategy" is designed to identify and trade harmonic price patterns with optimized entry and exit points using Fibonacci levels. The strategy implements various popular harmonic patterns including Bat, Butterfly, Gartley, Crab, Shark, ABCD, and their anti-patterns.
Key Features
Pattern Recognition: Identifies 17+ harmonic price patterns including standard and anti-patterns
Fibonacci-Based Entries and Exits: Uses customizable Fibonacci levels for precision entries, take profits, and stop losses
Alternative Timeframe Analysis: Option to use higher timeframes for pattern identification
Heiken Ashi Support: Optional use of Heiken Ashi candles instead of regular candlesticks
Visual Indicators:
Pattern visualization with ZigZag indicator
Buy/sell signal markers
Color-coded background to highlight active trade zones
Customizable Fibonacci level display
How It Works
The strategy uses a ZigZag-based pattern identification system to detect pivot points
When a valid harmonic pattern forms, the strategy calculates the optimal entry window using the specified Fibonacci level (default 0.382)
Entries trigger when price returns to the entry window after pattern completion
Take profit and stop loss levels are automatically set based on customizable Fibonacci ratios
Visual alerts notify you of entries and exits
The strategy tracks active trades and displays them with background color highlights
Customizable Settings
Trade size
Entry window Fibonacci level (default 0.382)
Take profit Fibonacci level (default 0.618)
Stop loss Fibonacci level (default -0.618)
Alert messages for entries and exits
Display options for specific Fibonacci levels
Alternative timeframe selection
This strategy is designed to fix repainting issues that are common in harmonic pattern strategies, ensuring more reliable signals and backtesting results.

*Auto Backtest & Optimize EngineFull-featured Engine for Automatic Backtesting and parameter optimization. Allows you to test millions of different combinations of stop-loss and take profit parameters, including on any connected indicators.
⭕️ Key Futures
Quickly identify the optimal parameters for your strategy.
Automatically generate and test thousands of parameter combinations.
A simple Genetic Algorithm for result selection.
Saves time on manual testing of multiple parameters.
Detailed analysis, sorting, filtering and statistics of results.
Detailed control panel with many tooltips.
Display of key metrics: Profit, Win Rate, etc..
Comprehensive Strategy Score calculation.
In-depth analysis of the performance of different types of stop-losses.
Possibility to use to calculate the best Stop-Take parameters for your position.
Ability to test your own functions and signals.
Customizable visualization of results.
Flexible Stop-Loss Settings:
• Auto ━ Allows you to test all types of Stop Losses at once(listed below).
• S.VOLATY ━ Static stop based on volatility (Fixed, ATR, STDEV).
• Trailing ━ Classic trailing stop following the price.
• Fast Trail ━ Accelerated trailing stop that reacts faster to price movements.
• Volatility ━ Dynamic stop based on volatility indicators.
• Chandelier ━ Stop based on price extremes.
• Activator ━ Dynamic stop based on SAR.
• MA ━ Stop based on moving averages (9 different types).
• SAR ━ Parabolic SAR (Stop and Reverse).
Advanced Take-Profit Options:
• R:R: Risk/Reward ━ sets TP based on SL size.
• T.VOLATY ━ Calculation based on volatility indicators (Fixed, ATR, STDEV).
Testing Modes:
• Stops ━ Cyclical stop-loss testing
• Pivot Point Example ━ Example of using pivot points
• External Example ━ Built-in example how test functions with different parameters
• External Signal ━ Using external signals
⭕️ Usage
━ First Steps:
When opening, select any point on the chart. It will not affect anything until you turn on Manual Start mode (more on this below).
The chart will immediately show the best results of the default Auto mode. You can switch Part's to try to find even better results in the table.
Now you can display any result from the table on the chart by entering its ID in the settings.
Repeat steps 3-4 until you determine which type of Stop Loss you like best. Then set it in the settings instead of Auto mode.
* Example: I flipped through 14 parts before I liked the first result and entered its ID so I could visually evaluate it on the chart.
Then select the stop loss type, choose it in place of Auto mode and repeat steps 3-4 or immediately follow the recommendations of the algorithm.
Now the Genetic Algorithm at the bottom right will prompt you to enter the Parameters you need to search for and select even better results.
Parameters must be entered All at once before they are updated. Enter recommendations strictly in fields with the same names.
Repeat steps 5-6 until there are approximately 10 Part's left or as you like. And after that, easily pour through the remaining Parts and select the best parameters.
━ Example of the finished result.
━ Example of use with Takes
You can also test at the same time along with Take Profit. In this example, I simply enabled Risk/Reward mode and immediately specified in the TP field Maximum RR, Minimum RR and Step. So in this example I can test (3-1) / 0.1 = 20 Takes of different sizes. There are additional tips in the settings.
━
* Soon you will start to understand how the system works and things will become much easier.
* If something doesn't work, just reset the engine settings and start over again.
* Use the tips I have left in the settings and on the Panel.
━ Details:
Sort ━ Sorting results by Score, Profit, Trades, etc..
Filter ━ Filtring results by Score, Profit, Trades, etc..
Trade Type ━ Ability to disable Long\Short but only from statistics.
BackWin ━ Backtest Window Number of Candle the script can test.
Manual Start ━ Enabling it will allow you to call a Stop from a selected point. which you selected when you started the engine.
* If you have a real open position then this mode can help to save good Stop\Take for it.
1 - 9 Сheckboxs ━ Allow you to disable any stop from Auto mode.
Ex Source - Allow you to test Stops/Takes from connected indicators.
Connection guide:
//@version=6
indicator("My script")
rsi = ta.rsi(close, 14)
buy = not na(rsi) and ta.crossover (rsi, 40) // OS = 40
sell = not na(rsi) and ta.crossunder(rsi, 60) // OB = 60
Signal = buy ? +1 : sell ? -1 : 0
plot(Signal, "🔌Connector🔌", display = display.none)
* Format the signal for your indicator in a similar style and then select it in Ex Source.
⭕️ How it Works
Hypothesis of Uniform Distribution of Rare Elements After Mixing.
'This hypothesis states that if an array of N elements contains K valid elements, then after mixing, these valid elements will be approximately uniformly distributed.'
'This means that in a random sample of k elements, the proportion of valid elements should closely match their proportion in the original array, with some random variation.'
'According to the central limit theorem, repeated sampling will result in an average count of valid elements following a normal distribution.'
'This supports the assumption that the valid elements are evenly spread across the array.'
'To test this hypothesis, we can conduct an experiment:'
'Create an array of 1,000,000 elements.'
'Select 1,000 random elements (1%) for validation.'
'Shuffle the array and divide it into groups of 1,000 elements.'
'If the hypothesis holds, each group should contain, on average, 1~ valid element, with minor variations.'
* I'd like to attach more details to My hypothesis but it won't be very relevant here. Since this is a whole separate topic, I will leave the minimum part for understanding the engine.
Practical Application
To apply this hypothesis, I needed a way to generate and thoroughly mix numerous possible combinations. Within Pine, generating over 100,000 combinations presents significant challenges, and storing millions of combinations requires excessive resources.
I developed an efficient mechanism that generates combinations in random order to address these limitations. While conventional methods often produce duplicates or require generating a complete list first, my approach guarantees that the first 10% of possible combinations are both unique and well-distributed. Based on my hypothesis, this sampling is sufficient to determine optimal testing parameters.
Most generators and randomizers fail to accommodate both my hypothesis and Pine's constraints. My solution utilizes a simple Linear Congruential Generator (LCG) for pseudo-randomization, enhanced with prime numbers to increase entropy during generation. I pre-generate the entire parameter range and then apply systematic mixing. This approach, combined with a hybrid combinatorial array-filling technique with linear distribution, delivers excellent generation quality.
My engine can efficiently generate and verify 300 unique combinations per batch. Based on the above, to determine optimal values, only 10-20 Parts need to be manually scrolled through to find the appropriate value or range, eliminating the need for exhaustive testing of millions of parameter combinations.
For the Score statistic I applied all the same, generated a range of Weights, distributed them randomly for each type of statistic to avoid manual distribution.
Score ━ based on Trade, Profit, WinRate, Profit Factor, Drawdown, Sharpe & Sortino & Omega & Calmar Ratio.
⭕️ Notes
For attentive users, a little tricks :)
To save time, switch parts every 3 seconds without waiting for it to load. After 10-20 parts, stop and wait for loading. If the pause is correct, you can switch between the rest of the parts without loading, as they will be cached. This used to work without having to wait for a pause, but now it does slower. This will save a lot of time if you are going to do a deeper backtest.
Sometimes you'll get the error “The scripts take too long to execute.”
For a quick fix you just need to switch the TF or Ticker back and forth and most likely everything will load.
The error appears because of problems on the side of the site because the engine is very heavy. It can also appear if you set too long a period for testing in BackWin or use a heavy indicator for testing.
Manual Start - Allow you to Start you Result from any point. Which in turn can help you choose a good stop-stick for your real position.
* It took me half a year from idea to current realization. This seems to be one of the few ways to build something automatic in backtest format and in this particular Pine environment. There are already better projects in other languages, and they are created much easier and faster because there are no limitations except for personal PC. If you see solutions to improve this system I would be glad if you share the code. At the moment I am tired and will continue him not soon.
Also You can use my previosly big Backtest project with more manual settings(updated soon)

Volatility-Enhanced Williams %R [AIBitcoinTrend]👽 Volatility-Enhanced Williams %R (AIBitcoinTrend)
The Volatility-Enhanced Williams %R takes the classic Williams %R oscillator to the next level by incorporating volatility-adaptive smoothing, making it significantly more responsive to market dynamics. Unlike the traditional version, which uses a fixed calculation method, this indicator dynamically adjusts its smoothing factor based on market volatility, helping traders capture trends more effectively while filtering out noise.
Additionally, the indicator includes real-time divergence detection and an ATR-based trailing stop system, providing traders with enhanced risk management tools and early reversal signals.
👽 What Makes the Volatility-Enhanced Williams %R Unique?
Unlike the standard Williams %R, which applies a simple lookback-based formula, this version integrates adaptive smoothing and volatility-based filtering to refine its signals and reduce false breakouts.
✅ Volatility-Adaptive Smoothing – Adjusts dynamically based on standard deviation, enhancing signal accuracy.
✅ Real-Time Divergence Detection – Identifies bullish and bearish divergences for early trend reversal signals.
✅ Crossovers & Trailing Stops – Implements Williams %R crossovers with ATR-based trailing stops for intelligent trade management.
👽 The Math Behind the Indicator
👾 Volatility-Adaptive Smoothing
The indicator smooths the Williams %R calculation by applying an adaptive filtering mechanism, which adjusts its responsiveness based on market conditions. This helps to eliminate whipsaws and makes trend-following strategies more reliable.
The smoothing function is defined as:
clamp(x, lo, hi) => math.min(math.max(x, lo), hi)
adaptive(src, prev, len, divisor, minAlpha, maxAlpha) =>
vol = ta.stdev(src, len)
alpha = clamp(vol / divisor, minAlpha, maxAlpha)
prev + alpha * (src - prev)
Where:
Volatility Factor (vol) measures price dispersion using standard deviation.
Adaptive Alpha (alpha) dynamically adjusts smoothing strength.
Clamped Output ensures that the smoothing factor remains within a stable range.
👽 How Traders Can Use This Indicator
👾 Divergence Trading Strategy
Bullish Divergence Setup:
Price makes a lower low, while Williams %R forms a higher low.
Buy signal is confirmed when Williams %R reverses upward.
Bearish Divergence Setup:
Price makes a higher high, while Williams %R forms a lower high.
Sell signal is confirmed when Williams %R reverses downward.
👾 Trailing Stop & Signal-Based Trading
Bullish Setup:
✅ Williams %R crosses above trigger level → Buy signal.
✅ A bullish trailing stop is placed at Low - (ATR × Multiplier).
✅ Exit if price crosses below the stop.
Bearish Setup:
✅ Williams %R crosses below trigger level → Sell signal.
✅ A bearish trailing stop is placed at High + (ATR × Multiplier).
✅ Exit if price crosses above the stop.
👽 Why It’s Useful for Traders
Adaptive Filtering Mechanism – Avoids excessive noise while maintaining responsiveness.
Real-Time Divergence Alerts – Helps traders anticipate market reversals before they occur.
ATR-Based Risk Management – Stops dynamically adjust based on market volatility.
Multi-Market Compatibility – Works effectively across stocks, forex, crypto, and futures.
👽 Indicator Settings
Smoothing Factor – Controls how aggressively the indicator adapts to volatility.
Enable Divergence Analysis – Activates real-time divergence detection.
Lookback Period – Defines the number of bars for detecting pivot points.
Enable Crosses Signals – Turns on Williams %R crossover-based trade signals.
ATR Multiplier – Adjusts trailing stop sensitivity.
Disclaimer: This indicator is designed for educational purposes and does not constitute financial advice. Please consult a qualified financial advisor before making investment decisions.